
Blog Post
Orioles Stolen-Base Review: Efficiency Before More Attempts

BY THE NUMBERS
Baltimore’s 78 stolen bases came with 33 times caught stealing in MLB’s 2026 listing. That combination points toward a more selective running game, not a simple demand for more attempts.
The stolen-base total is only half the story. MLB’s 2026 team statistics list 78 steals and 33 caught stealing for the Orioles, a success rate of 70.3 percent when calculated as steals divided by steals plus caught stealing.
Across the 30 major-league teams in the same listing, the totals were 3,289 steals and 984 caught stealing. That produces a combined rate of 77.0 percent. Baltimore was roughly 6.7 percentage points below that aggregate figure.
The comparison does not tell us which individual decisions were wrong. It does establish a useful offseason question: how can the Orioles choose better opportunities before asking the running game to do more?
Volume and efficiency are different problems
Twenty-four teams recorded more than Baltimore’s 78 steals. Texas also had 78, leaving the Orioles tied for 25th in the listing. Baltimore therefore combined a relatively modest total with a success rate below the league aggregate.
That is not an automatic argument for being more aggressive. More attempts are useful only if the extra opportunities are good enough to justify the risk of making outs. Repeating an inefficient pattern at greater volume would not address the underlying issue.
Our view: the first goal should be improving the quality of the decisions. A faster roster might create additional chances, but speed alone would not explain when a runner should go, which pitcher-catcher combinations to challenge or how game circumstances change the calculation.
What the percentage can—and cannot—show
The 77.0 percent figure is a combined league rate, calculated from all recorded steals and caught-stealing totals. It is not an average of 30 team percentages. Teams with more recorded outcomes contribute more to that combined number.
It is also not a universal break-even target. The value of an extra base and the cost of an out depend on the situation. A season-level comparison cannot capture every score, inning, hitter or base-out state in which a decision occurred.
Nor is this a complete grade for baserunning. The calculation does not measure every advance on a hit, every extra base declined or every out elsewhere on the bases. Those questions require a broader review than the two columns used here.
Review the choices before prescribing a cure
A useful Orioles review would separate runners, opponents and situations. Were the unsuccessful plays concentrated among a few players? Did opportunities against particular batteries look better in advance than they proved to be? Were the attempts part of the same tactic, or very different decisions grouped together by the season totals?
Those are questions for play-level evidence, not conclusions available from a team leaderboard. The numbers here cannot assign responsibility to a player or coach, and they should not be used to do so.
They can help set the order of the conversation. First establish where Baltimore lost efficiency. Then decide whether the best response is more restraint, better preparation, different personnel or a combination of changes.
The Orioles do not need to win a stolen-base leaderboard to build a better offense. They need the running game to contribute without giving away too many opportunities for the hitters behind it.
For another part of Baltimore’s offseason planning, read our analysis of the outfield search.
Sources and methodology
- MLB official 2026 Orioles team hitting statistics: 78 steals and 33 caught stealing; returned listing covers 161 games.
- MLB official 30-team hitting-statistics listing, used for the aggregate comparison and stolen-base ranking.
Calculations: 78 ÷ (78 + 33) = 70.3%; 3,289 ÷ (3,289 + 984) = 77.0%, rounded to one decimal place. Research cutoff: November 9, 2026, 2:03 p.m. Eastern. Figures describe the retrieved MLB listings; missing-game totals have not been estimated. Recommendations are Birdland Today analysis.
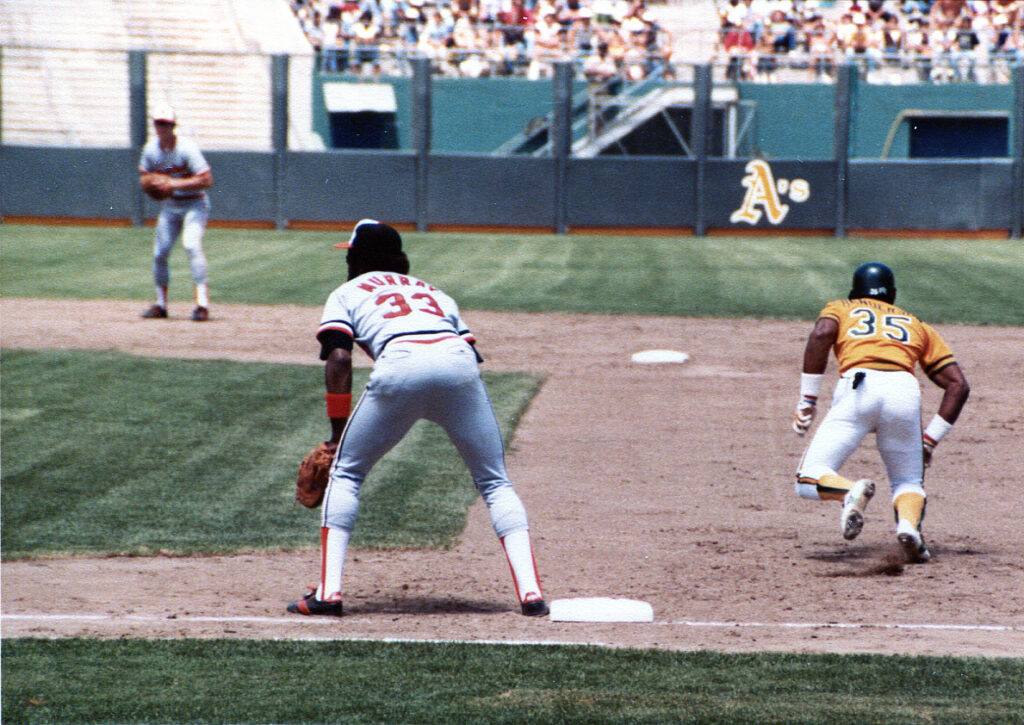
Photo: Oriole Park at Camden Yards, June 1, 2013, by Keith Allison, via Wikimedia Commons, CC BY-SA 2.0. Archival setting photograph, not a 2026 play. Original unmodified; website resizing/display cropping may apply.

Keep reading
Related Blog Posts
How the Orioles Closed Out the 1983 World Series
Murray’s two homers, Dempsey’s extra-base hits and McGregor’s shutout powered Baltimore’s 1983 World Series clincher. Revisit the decisive game through MLB’s records.
Read Post
Orioles Outfield Search: More Than a Right-Handed Bat
Cowser, Beavers and O’Neill give Baltimore options, but the Orioles’ outfield search needs a clear plan for offense, defense and playing time—not just handedness.
Read Post
Orioles Pitching Review: What ERA Leaves Out
The Orioles’ 4.07 ERA and 739 runs allowed tell different stories. A closer look at the numbers explains what Baltimore’s offseason review should examine.
Read Post