
Blog Post
Orioles Pitching Review: What ERA Leaves Out

BY THE NUMBERS
The Orioles’ 4.07 team ERA and 739 runs allowed describe different parts of the same season. Reading them together gives Baltimore a better starting point for its offseason pitching review.
A pitching staff can look different depending on which column gets the attention. For the 2026 Orioles, MLB’s season statistics list a 4.07 ERA, 649 earned runs and 739 total runs allowed. The gap is 90 runs.
That difference deserves attention, but it does not supply a ready-made explanation for Baltimore’s season. It is neither a count of fielding errors nor a reliable estimate of how many wins a defensive upgrade would add. It is a reason to ask better questions before reducing the offseason to one pitching statistic.
Put the two rates beside each other
ERA measures earned runs per nine innings. MLB’s listing credits the Orioles with 1,436⅓ innings; using all 739 runs over those innings produces roughly 4.63 runs allowed per nine. That is about 0.56 higher than the listed ERA.
The calculation uses innings, not games. Baseball’s notation of 1,436.1 means 1,436 innings and one out—not 1,436 and one-tenth innings. Treating that final digit as a decimal would give the calculation the wrong denominator.
The two rates answer different questions. One tracks the earned-run category. The other keeps every run in the accounting. For a team trying to win games, both belong in the review.
The 90-run gap is a question, not a verdict
Errors and passed balls affect earned-run classification. Official scoring also requires judgment about how an inning would have unfolded.
That makes it risky to turn the gap into a simple defense grade. A season total cannot identify who should have made a particular play, how difficult that play was or what happened afterward. Those conclusions require play-level evidence.
Nor should Baltimore treat the gap as 90 runs waiting to disappear. An offseason projection needs to explain which plays, players or processes might change. Subtracting a disappointing category from last season’s total is not a plan for preventing it next year.
Read the supporting numbers
MLB also lists 1,305 strikeouts, 535 walks and 169 home runs allowed for Baltimore. Those are useful starting points for evaluating how the staff reached its results. They are not, by themselves, a diagnosis of every pitcher or a ranking against the rest of the league.
A useful review would separate starters from relievers, examine individual workloads and identify which pitchers are likely to supply the next season’s innings. Team totals mix together everyone who contributed, including players who may not occupy the same roles again.
Our view: Baltimore should assess acquisitions by the specific problem they can help solve. A pitcher who offers more dependable innings addresses a different need from a defender who converts more balls into outs. The best roster could benefit from both; one headline statistic cannot settle that choice.
The practical lesson for fans is to keep the full line in view. A 4.07 ERA is meaningful. So are 739 runs allowed. The offseason argument becomes more useful when neither number is asked to explain everything.
Read more about Baltimore’s rotation priorities and the choices behind its open roster spots.
Sources and methodology
- MLB official 2026 Orioles team pitching statistics, retrieved November 7, 2026. The returned listing covers 161 games. All figures here refer to that listing; no missing-game totals have been estimated.
- MLB ERA glossary and unearned-run glossary.
Calculations: 739 − 649 = 90; 739 × 9 ÷ (1,436 + ⅓) = 4.63054…, rounded to 4.63. Research cutoff: November 7, 2026, 7:58 a.m. Eastern. Interpretations are Birdland Today analysis; this is a season statistical review, not a game recap.
Photo: Oriole Park at Camden Yards on June 1, 2013, by Keith Allison, via Wikimedia Commons, CC BY-SA 2.0. Archival setting photograph, not imagery of the 2026 season. Original unmodified; website resizing and display cropping may apply.

Keep reading
Related Blog Posts
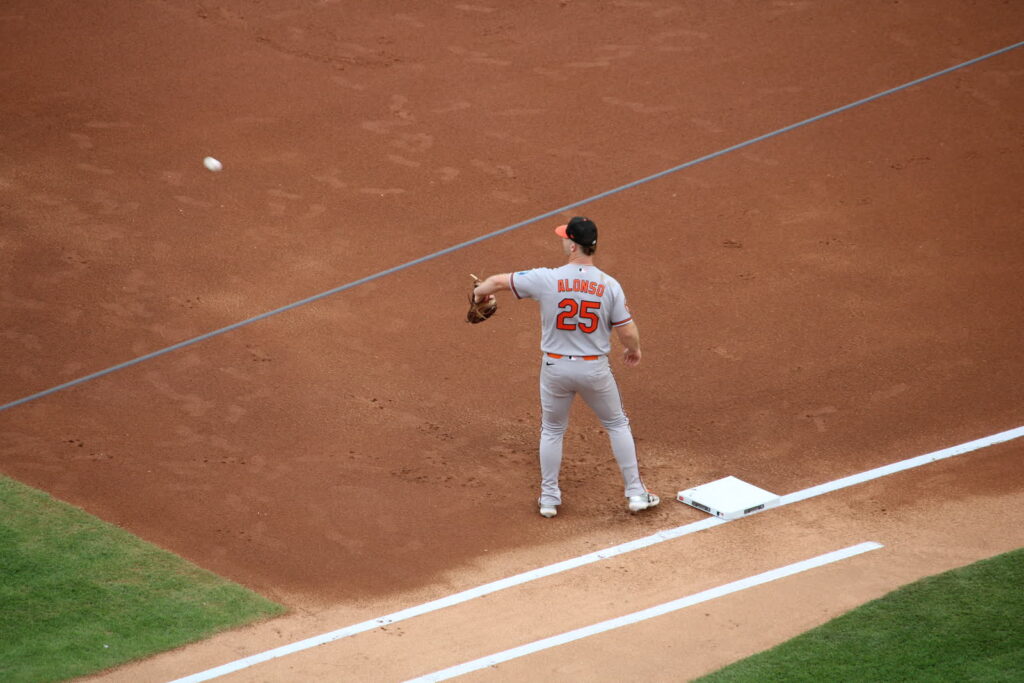
Pete Alonso Delivered the Power. Baltimore Must Build Around It.
Forty-three home runs and a .363 on-base percentage gave Baltimore a clear return from Pete Alonso. The next challenge is building a deeper lineup around him.
Read Post
Adley Rutschman’s 2025 Slump and the Danger of a Career Verdict
A look back at Adley Rutschman’s May 2025 decline, the evidence available then and the limits of turning a difficult stretch into a career verdict.
Read Post
Why the Orioles’ Three Open 40-Man Roster Spots Matter
Baltimore has three open 40-man roster spots. How the Orioles balance prospect protection, potential additions and flexibility will shape their offseason choices.
Read Post